GSICS Wiki>Development web>Microwave-Deliverable (16 Jan 2019, ManikBali)


Level 1C inter calibration tables ( Proposed as a Deliverable)
by Wes Berg (Colorado State University: E-Mail: berg (AT) atmos(DOT)colostate(DOT)edu )The attached tar file provided by Web Berg contains the current Level 1C intercalibration tables for 13 imagers and 11 sounders along with a couple of journal pubs, software to read and apply the tables and a README document with descriptions and details.


Fulfillment of GSICS-Deliverable Acceptance Criterion
1.Objective of the LUT All of the intercalibration offsets from the tables are applied to calibrated brightness temperatures from the operational Level 1B data. For many of the sounders the Level 1B is referred to as the Sensor Data Records, or SDR files. The exception to this is the DMSP sensors, which used as input 1Base files produced by the Precipitation Processing System (PPS) at the NASA Goddard Space flight center. The input 1Base files for the SSM/I and SSMIS instruments apply a number of calibration corrections described in Berg et al. (2018). 2. How it was created Details can be found in the attached paper Berg et al 2016 and Berg et al 2018. In summarry The calibration tables are based on tie points, for which the given intercalibration offset applies to a specified scene temperature. The first value in the table for each channel is the number of tie points. A value of zero indicates no intercalibration is applied. A value of 1 indicates a constant intercalibration offset is applied (this is the case for most of the water vapor sounding channels). If there are two or more tie points, the applied intercalibration offset is interpolated between the specified scene temperature of the tie points. The offset for the lowest tie point is used below the scene temperature of that tie point and the offset for the highest tie point is used above the scene temperature of that tie point as the intercalibration offsets are not extrapolated. Software is provided in both IDL and Fortran90 to read and apply the calibration tables. 3. How to use it Fortran and IDL Codes that aid in using the tables are provided 4. References: Publications, websites etc. Berg, W.; Kroodsma, R.; Kummerow, C.D.; McKague, D.S. Fundamental Climate Data Records of Microwave Brightness Temperatures. Remote Sens. 2018, 10, 1306. Berg, W., and Coauthors, 2016: Intercalibration of the GPM microwave radiometer constellation. J. Atmos. Oceanic Technol., 33, 2639–2654, doi:10.1175/JTECH -D-16-0100.1. (This section: Maintained by GCC)
The main contents of the tar file are
Description: PMM XCAL Intercalibration tables for Level 1C data (V05) Reference Sensor: GPM GMI Version V05 Sensors: 13 imagers and 11 water vapor sounders Date: 11 December 2018 Contact: Wesley Berg (berg@atmos.colostate.edu) XCAL Intercalibration Tables: Conical-Scanning Window Channel Radiometers- 1C.TRMM.TMI.XCAL2017-V.tbl
- 1C.AQUA.AMSRE.XCAL2017-V.tbl
- 1C.GCOMW-1.AMSR2.XCAL2016-V.tbl
- 1C.DMSP-F08.SSMI.XCAL2018-V.tbl
- 1C.DMSP-F10.SSMI.XCAL2018-V.tbl
- 1C.DMSP-F11.SSMI.XCAL2018-V.tbl
- 1C.DMSP-F13.SSMI.XCAL2018-V.tbl
- 1C.DMSP-F14.SSMI.XCAL2018-V.tbl
- 1C.DMSP-F15.SSMI.XCAL2018-V.tbl
- 1C.DMSP-F16.SSMIS.XCAL2016-V.tbl
- 1C.DMSP-F17.SSMIS.XCAL2016-V.tbl
- 1C.DMSP-F18.SSMIS.XCAL2016-V.tbl
- 1C.DMSP-F19.SSMIS.XCAL2016-V.tbl
- 1C.METOP-A.MHS.XCAL2016-V.tbl
- 1C.METOP-B.MHS.XCAL2016-V.tbl
- 1C.NOAA-15.AMSUB.XCAL2017-V.tbl
- 1C.NOAA-16.AMSUB.XCAL2017-V.tbl
- 1C.NOAA-17.AMSUB.XCAL2017-V.tbl
- 1C.NOAA-18.MHS.XCAL2016-V.tbl
- 1C.NOAA-19.MHS.XCAL2016-V.tbl
- 1C.NOAA-20.ATMS.XCAL2018-V.tbl
- 1C.NOAA-NPP.ATMS.XCAL2018a-V.tbl
- 1C.NOAA-NPP.ATMS.XCAL2018b-V.tbl
- 1C.MEGHA-TROPIQUES.SAPHIR.XCAL2016-V.tbl
- Berg2016.pdf
- Berg2018.pdf
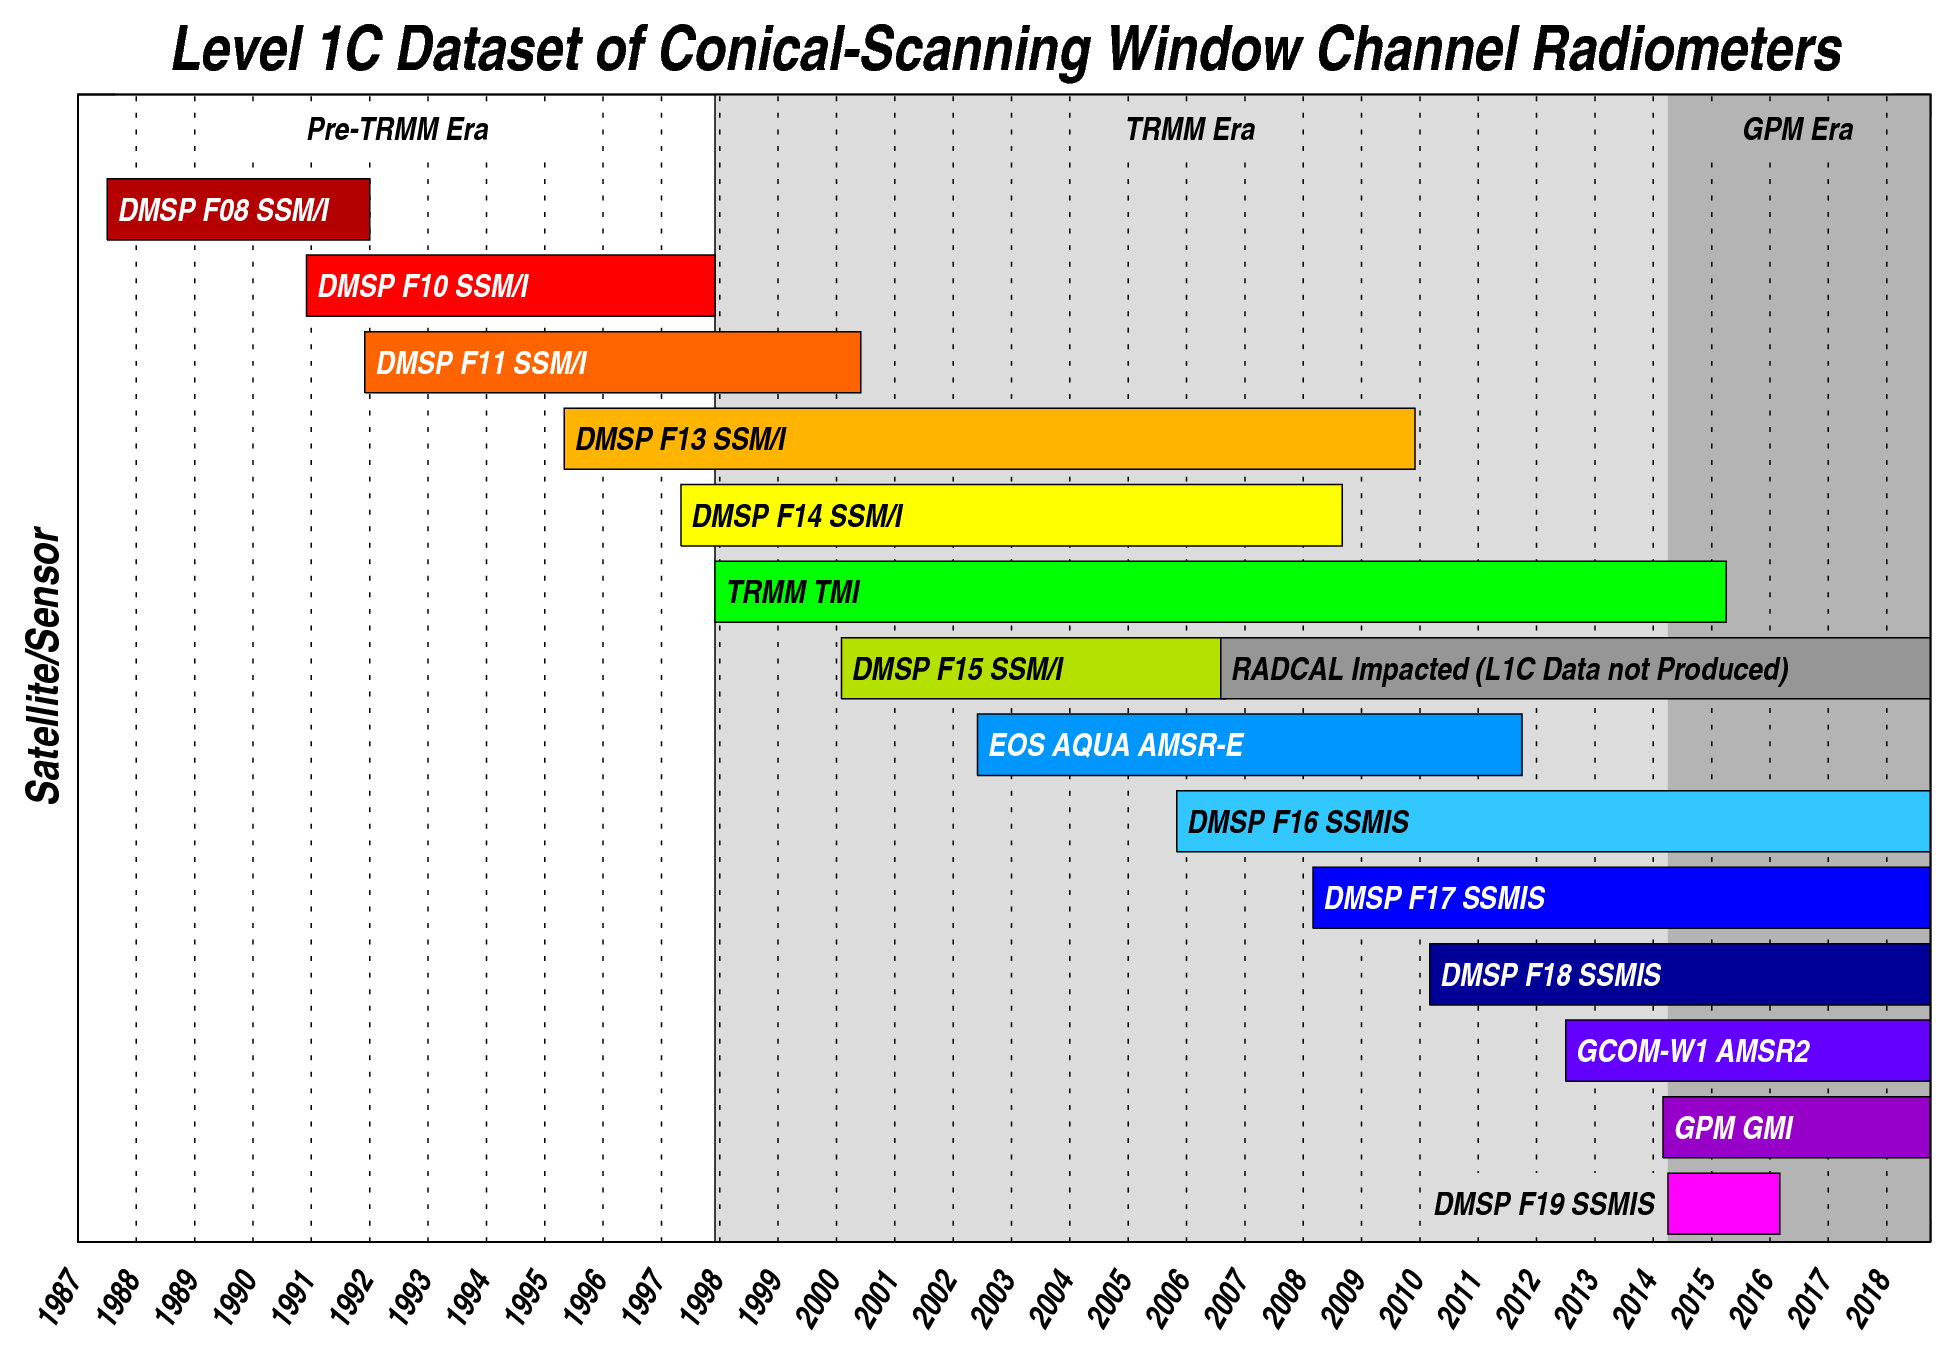
- L1C -imager-availability.png (Extent of Level 1C imager data available)
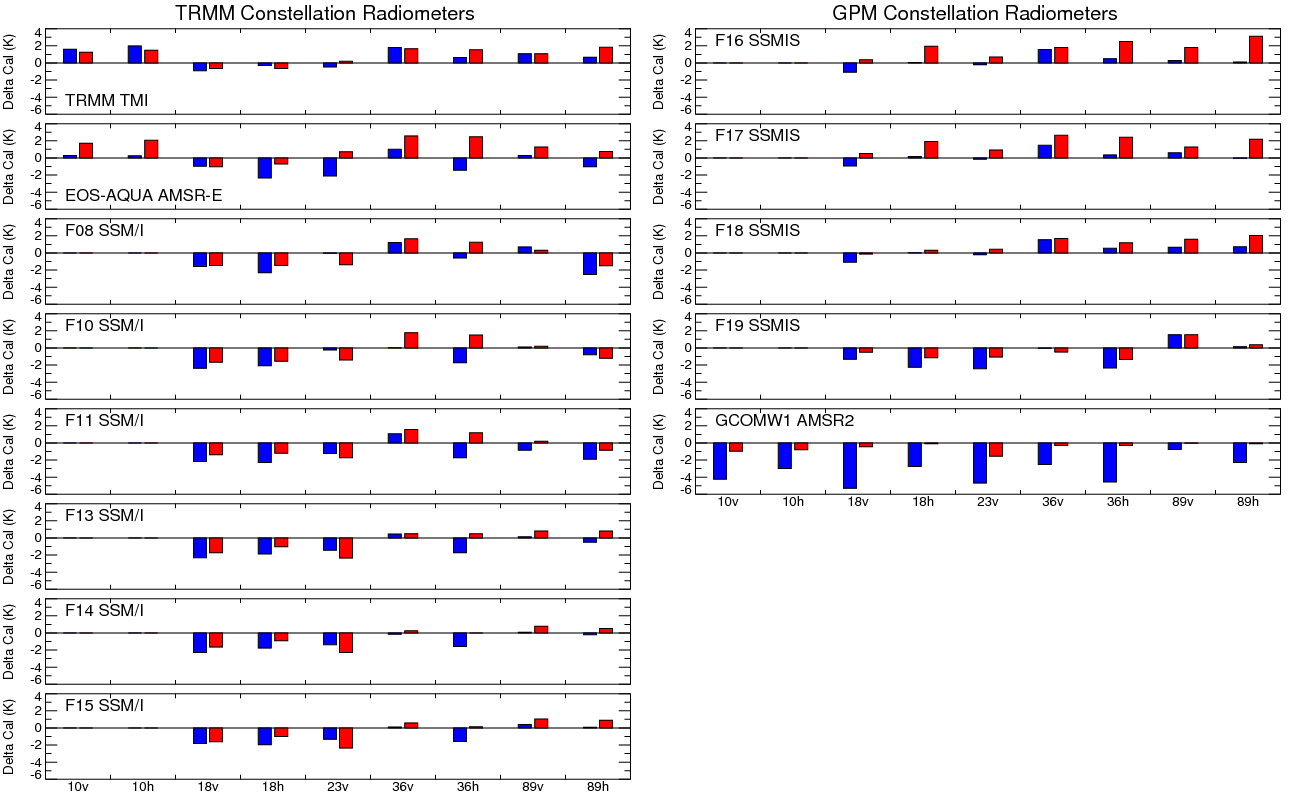
- L1C -imager-calibration.png (Bar charts of the intercalibration offsets for the imagers)
- L1C -sounder-availability.png (Extent of Level 1C sounder data available)
- L1C -sounder-calibration.png (Bar charts of the intercalibration offsets for the sounders)
- apply_cal.f90 (Fortran 90 function to read and apply calibration tables)
- read_table.pro (IDL function to read calibration tables)
- apply_cal.pro (IDL function to apply calibration tables)
- Example 1C.TRMM.TMI.XCAL2017-V.tbl (1C.satellite.sensor.intercalibration-version.tbl)
- The intercalibration version is the year the table was produced. The V indicates that the results were independently verified by multiple members of the XCAL team.
| I | Attachment | Action | Size | Date | Who | Comment |
|---|---|---|---|---|---|---|
| |
L1C-imager-availability.png | manage | 119 K | 15 Jan 2019 - 23:32 | ManikBali | |
| |
L1C-imager-calibration.png | manage | 26 K | 15 Jan 2019 - 23:32 | ManikBali | |
| |
XCAL-Tables.tar | manage | 2 MB | 15 Jan 2019 - 23:05 | ManikBali |
Edit | Attach | Print version | History: r2 < r1 | View wiki text | Edit wiki text | More topic actions
Topic revision: r2 - 16 Jan 2019, ManikBali
- Useful wiki links:
-
 Attach multiple files to current topic
-
 User wiki documentation
-
 Quick editing reference
-
 Good style tips
-
 Installed wiki extensions
-
 Member-only web
-
 Test Wiki
- Tag cloud:
(Clicking a tag finds all topics tagged with it.)
A Test Topic ATBD convention equations error assessment examples FAQ file naming GPPA GSICS Correction GSICS Monitoring Imager ISO 19115 JAMI Joint WG meeting LaTeX Logo Lunar Workshop meetings metadata microwave Moon MTSAT netCDF products solar channel SubGroup traceability users Web meeting workflow workshop workshops
 Copyright © by the contributing authors. All material on this collaboration platform is the property of the contributing authors.
 Ideas, requests, problems regarding GSICS Wiki? Send feedback


